I always wanted to have a tool to monitor the network connections from my
laptop/desktop. I wanted to have alerts for random processes making network
connections, and a way to block those (if I want to).
Such a tool can provide peace of mind in a few cases. A reverse shell is one
the big one, just in case if I manage to open any random malware (read
downloads) on my regular Linux system, I want to be notified about the
connections it will make. The same goes for trying out any new application. I
prefer to use Qubes OS based VMs testing random
binaries and applications, and it is also my daily driver. But, the search for
a proper tool continued for some time.
Introducing unoon
Unoon is a desktop tool that I started
writing for monitoring network connections for my system. It has two parts,
the backend is written in Go and that monitor and adds details to a local
Redis instance (this should be password protected).
I started writing this backend in Rust, but then I had to rewrite it in Go as
I wanted to reuse parts of my code from another project so that I can track
all DNS queries from the system. This helps to make sense of the data;
otherwise, we will see some random IP numbers in the UI.
The frontend is written using PyQt5. Around 14 years ago, I released my first
ever released tool using PyQt, and it is still my favorite library to create a
desktop application.
Using the development version of unoon
The README has the build steps. You have to start the backend as a daemon, the
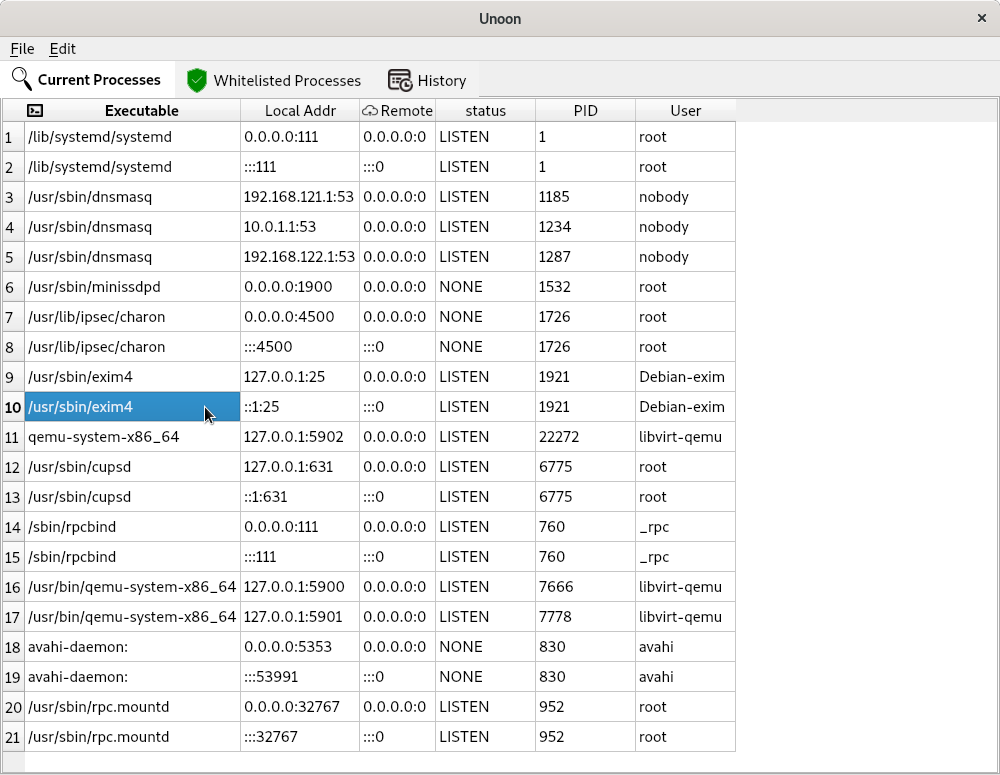
easiest option is to run it inside of a tmux shell. At first, it will show all
the currently running processes in the first “Current processes” tab. If you
add any executable (via the absolute path) in the Edit->whitelists dialog
and then save (and then restart the UI app), those will turn up the
whitelisted processes.
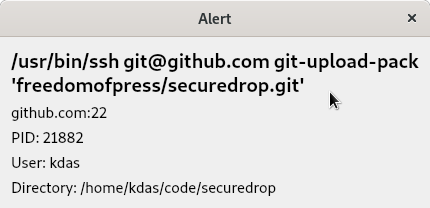
For any new process making network calls, you will get an alert dialog. In the
future, we will have the option to block hosts/ips via this alert dialog.
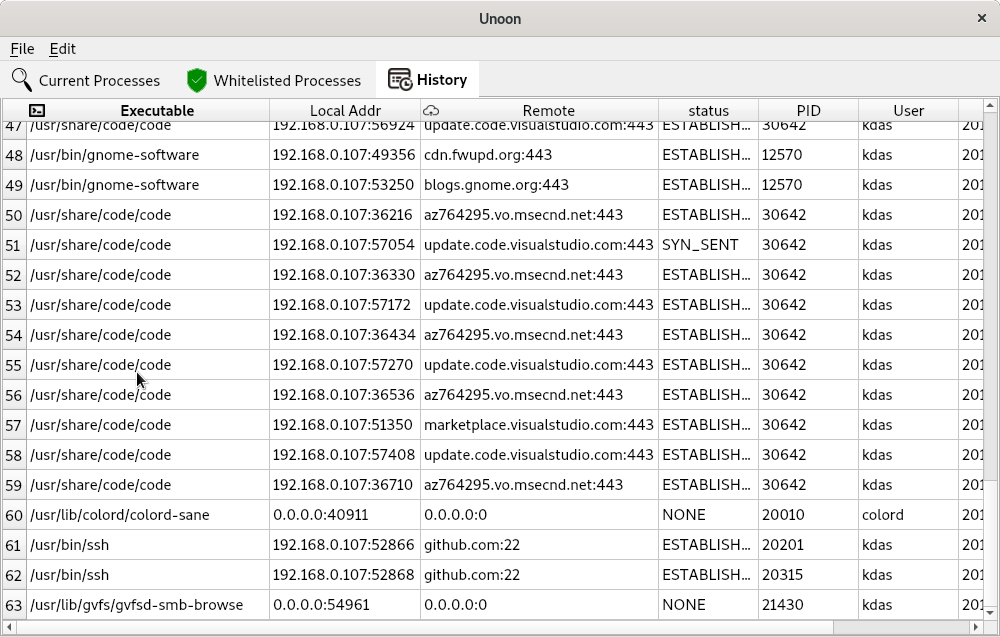
The history tabs will show all alerts history in the runtime. Again, we will
have to save this information in a local database, so that we can have better
statistics shown to the users.
You can move between different tabs/tables via Alt+1 or Alt+2 and Alt+3
key combinations.
I will add more options to create better-whitelisted processes. There is also
ongoing work to mark any normal process as a whitelisted one from the UI (by
right-clicking).
Last week, Micah and I managed to spend some
late-night hotel room hacking on this tool.
How can you help?
You can start by testing the code base, and provide suggestions on how to
improve the tool. Help in UX (major concern) and patches are always welcome.
A small funny story
A few weeks back, on a Sunday late night, I was demoing the very initial
version of the tool to Saptak. While we were
talking about the tool, suddenly, an entry popped up in the UI /usr/bin/ssh,
to a random host. A little bit of search showed that the IP belongs to an EC2
instance. For the next 40 minutes, we both were trying to debug to find out
what happened and if the system was already compromised or not. Luckily I was
talking about something else before, and to demo something (we totally forgot
that topic), I was running Wireshark on the system. From there, we figured
that the IP belongs to github.com. It took some more time to figure out that
one of my VS Code extension was updating the git, and was using ssh. This
is when I understood that I need to show the real domain names on the UI than
random IP addresses.